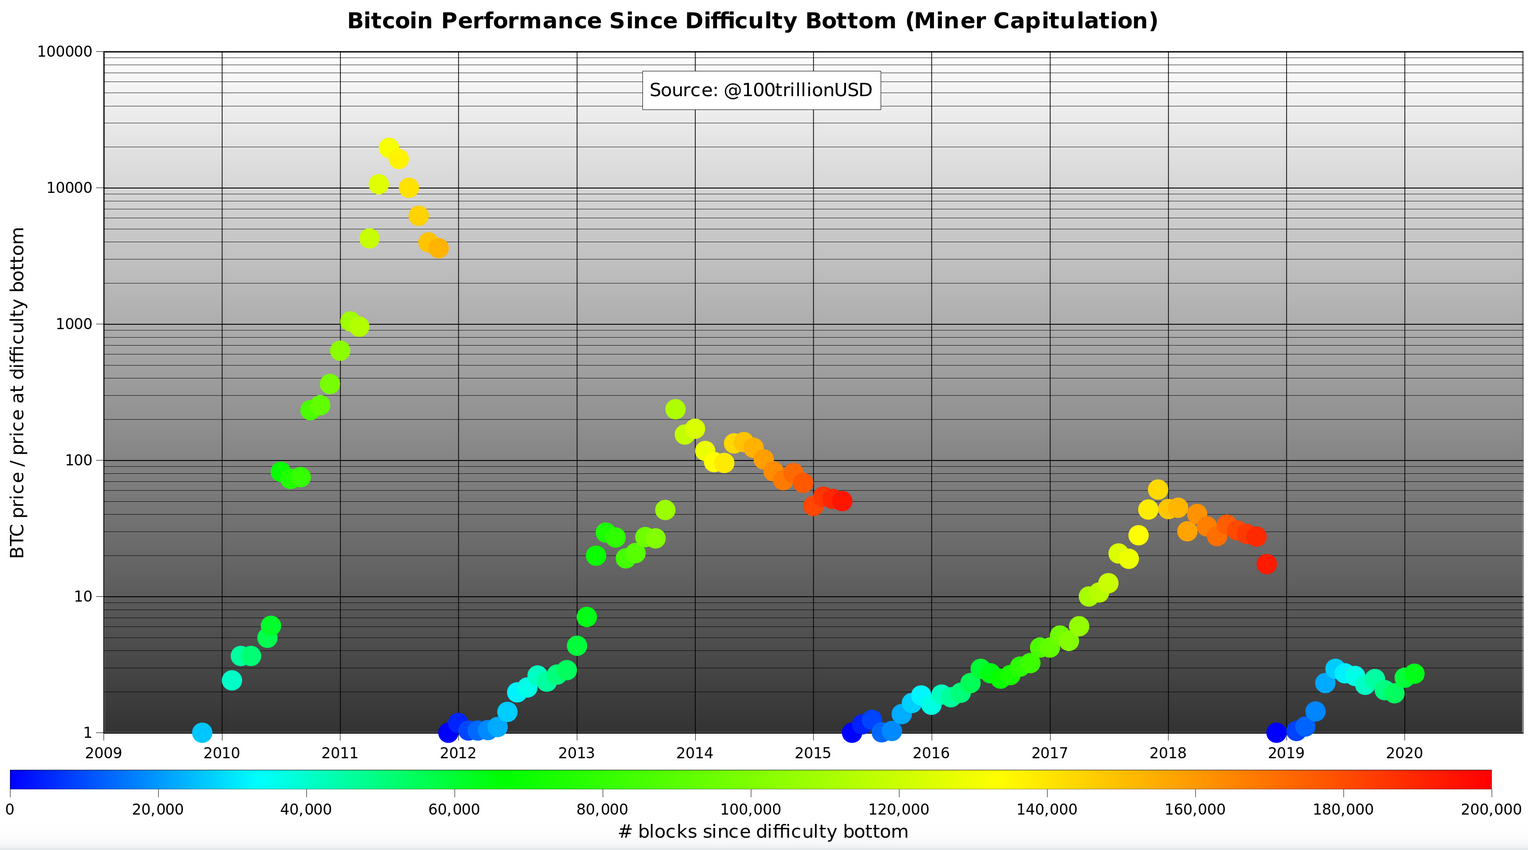
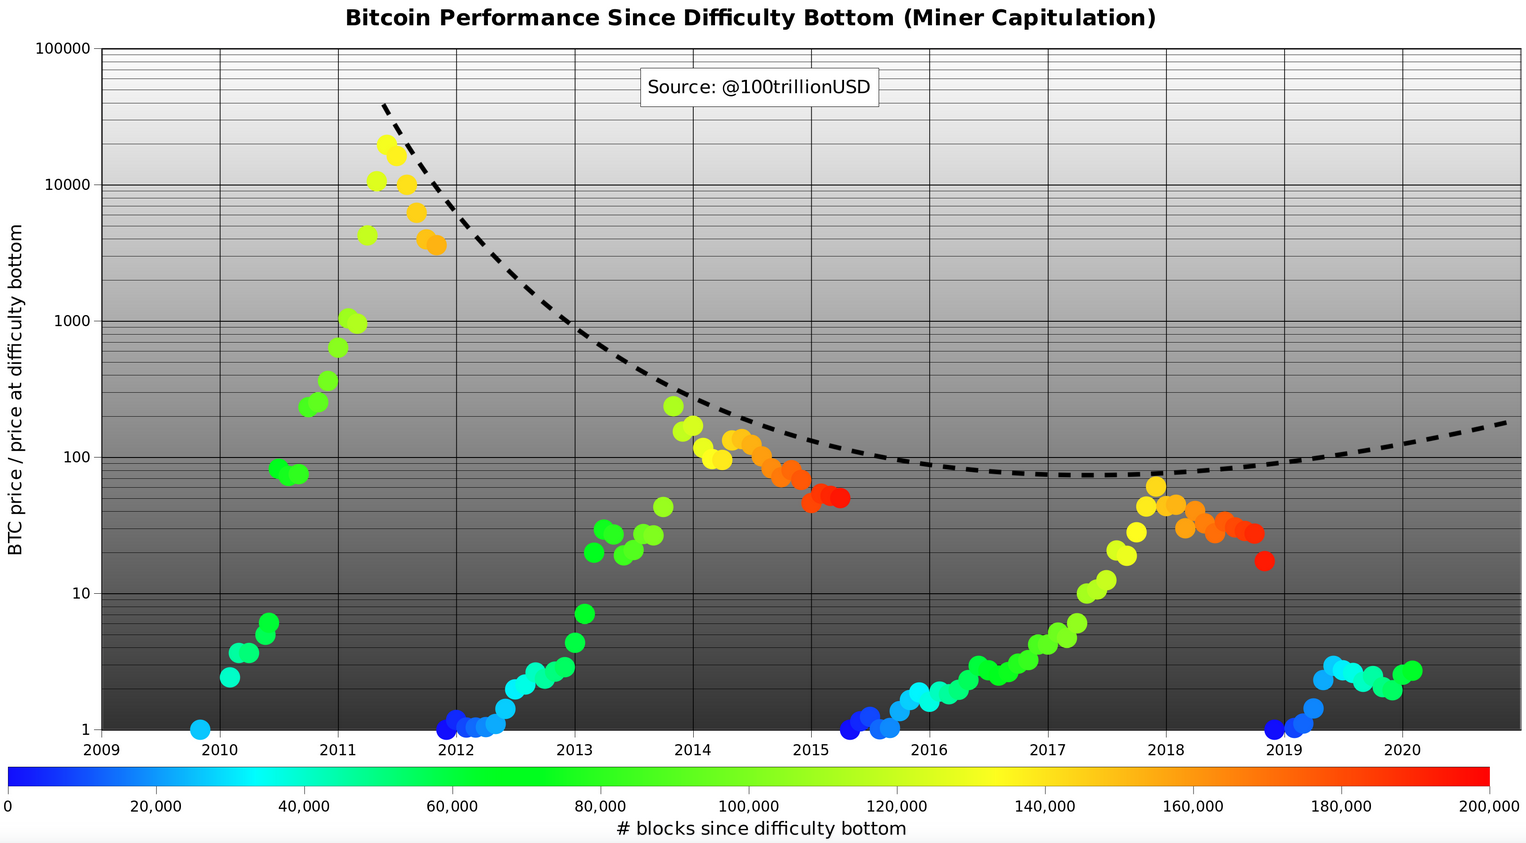
The Bitcoin Performance Since Difficulty Bottom chart shows the formation of a cup pattern peaking in spring 2021. This price prediction tool puts Bitcoin at an astonishing $400k by then.
#bitcoin $10k … it’s getting really interesting now pic.twitter.com/jocvo3sluD
— PlanB (@100trillionUSD) February 18, 2020
Bitcoin Performance Since Difficulty Bottom Chart
Following the weekend dip that spilled into Monday, business is resumed with Bitcoin back above $10k, and most of the alts posting green today.
With that, bullish sentiment has once again returned. And hodlers continue to dare to dream of what might be for the Bitcoin price, and indeed, the wider market as well.
Right on cue, analyst @100trillion USD, also known as Plan B, tweeted the chart below. It’s based on a ratio of current price over bottom price ($3.7k – December 2018) against time and represented by mining difficulty.

Bitcoin performance since difficulty bottom. (Source: twitter.com)
In each case, the ratio increases in line with mining difficulty until it peaks at around 120,000 – 140,000 blocks. With this comes a dip in the ratio as mining difficulty gets increasingly hard.
Current mining difficulty is at 80,000 blocks and based on the previous three cycles, there is room to grow up until the cup ceiling.

Cup formation on Bitcoin performance since difficulty bottom. (Source: twitter.com)
With that in mind, a ratio of 10, or 10 times the bottom ($3.7k), puts Bitcoin at around $37k come halving time. What’s more, a climb towards the ceiling will see a ratio of around 100, or 100 times the bottom, putting Bitcoin at $370k by spring 2021.
Caution Needs To Be Exercised
As expected, crypto Twitter is buzzing with talk of these ambitious price predictions. With one reply pointing out that this cycle sees the convergence of multiple bullish factors not present in previous cycles. In short, expectations go beyond the already sky-high forecasts.
“The Bitcoin halving is bigger than you know. The daily global #Bitcoin demand will be higher than the daily release of #BTC; this was not the case in 2012 or 2016. When the daily supply can’t fulfill the daily demand, we know what happens. We’re in new territory #Crypto kids.”
#bitcoin $10k … it’s getting really interesting now pic.twitter.com/jocvo3sluD
— PlanB (@100trillionUSD) February 18, 2020
Indeed, the Bitcoin Performance Since Difficulty Bottom chart above uses a number of arbitrary assumptions.
For example, there is no justification for why the bottom price in December 2018 was used as the denominator in the ratio current BTC/bottom BTC price. There was also a bottoming out in January 2015, which saw the price of Bitcoin sink to $104. How would the chart look if this bottom price was used?
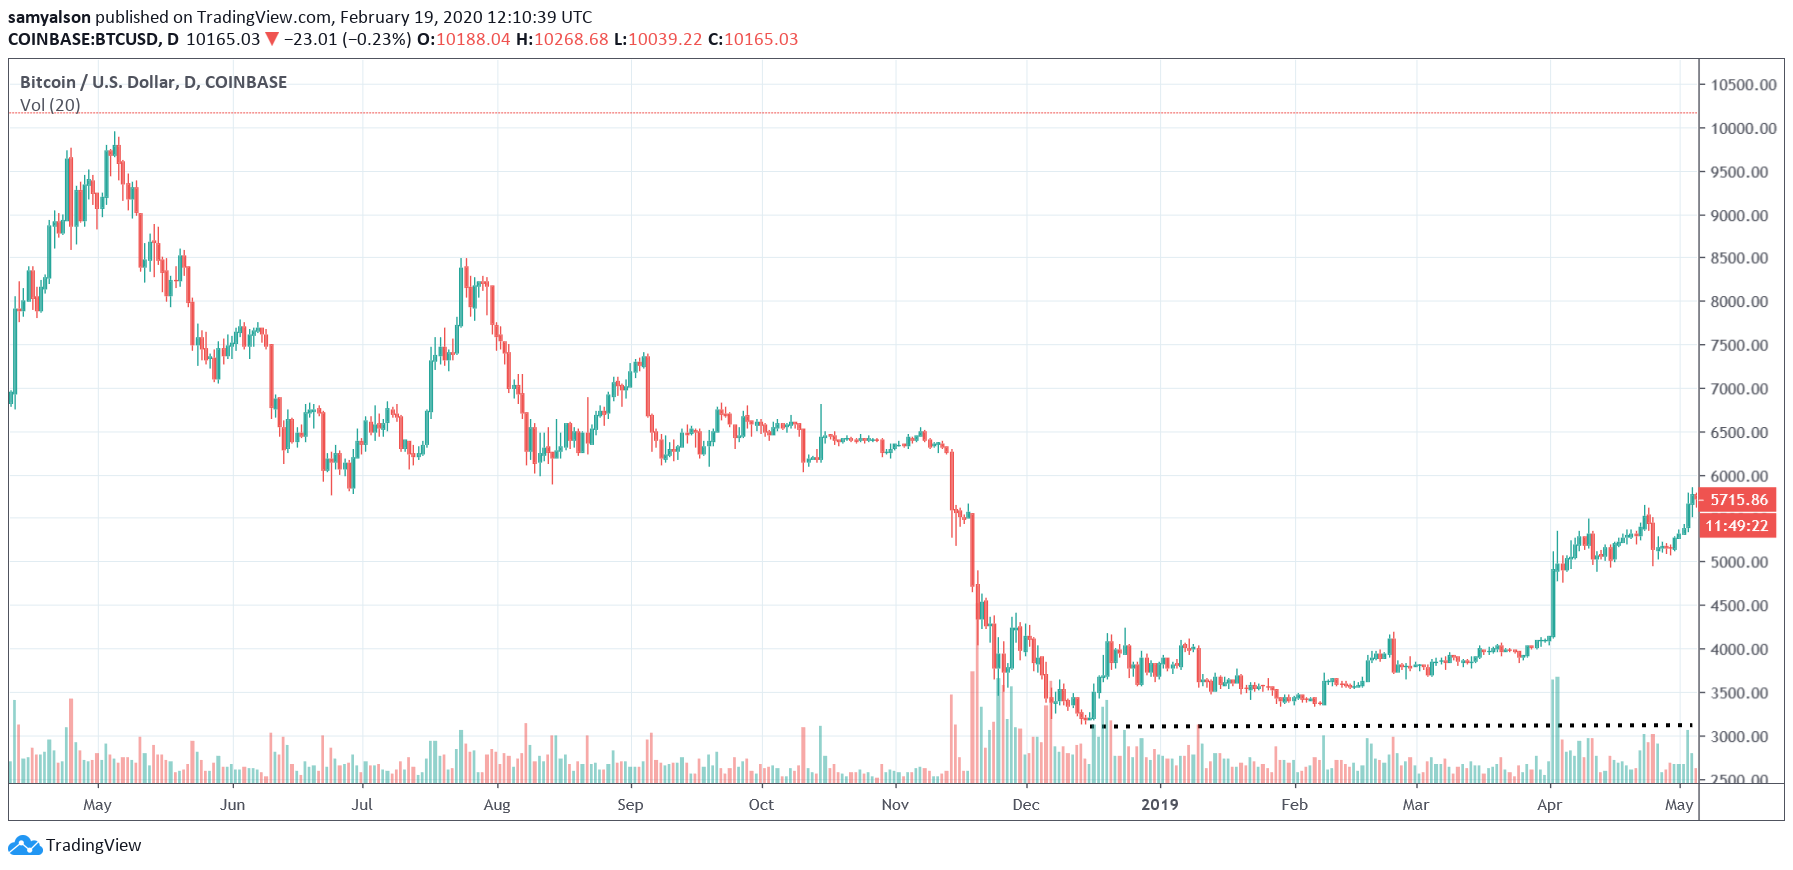
Also, an analysis of the bottom price on Coinbase shows the December 18 bottom was around $3.1k. While not hugely different to the figure used by Plan B, when multiplying by 100, a divergence of $60k is significant.

Bitcoin daily chart showing the bottoming price of the current cycle. (Source: tradingview.com)
As such, the efforts of analysts, such as Plan B, make the crypto community great. However, the need to temper our expectations is always wise.
Source: NEWS BTC


